
Snap-on (SNA): A Best-in-Class Industrial Franchise at a 34% P/E Discount to Peers
With 25.8% operating margins, $1B in free cash flow, and a fortress balance sheet, Snap-on's valuation gap to industrial peers appears excessive even after accounting for near-zero revenue growth.

Executive Summary
Snap-on trades at $381 — a 34% P/E discount to its industrial peer group median of 29.9x — despite generating best-in-class operating margins (25.8%), ~$1B in annual free cash flow, and maintaining one of the cleanest balance sheets in the industrial sector ($1.6B cash, 0.41x D/E, A2/A-/A credit ratings). Revenue growth has stalled near zero (+0.9% in FY2025), but this masks meaningful divergence across segments: the Repair Systems & Information Group grew organically 3.9% with expanding margins (26.7%, up 140 bps), while the legacy Tools Group (-1.2% organic) and Commercial & Industrial (-2.1% organic) weighed on the total.
The valuation discount is partially explained by four consecutive earnings misses and flat top-line growth, but the magnitude of the discount relative to the quality of the franchise appears excessive. Snap-on’s “manufacture where we sell” strategy across 36 global plants provides genuine tariff insulation — a structural advantage that should command a premium in the current trade environment. The 14% dividend increase (to $9.76 annualized, ~2.6% yield) signals management confidence in cash flow durability. With $1.6B in cash and $260M remaining under the buyback authorization, capital return provides a floor on total return even if growth remains muted.
The primary risk is that revenue stagnation proves to be early-cycle deterioration rather than a pause: the financial services portfolio (17.6% average yield on $2.4B in receivables) and the franchise channel create correlated downside if technician spending weakens further. Finance receivable originations declined 5.2% in FY2025, and the allowance ratio ticked up to 3.75% from 3.63%. These are not alarming moves, but they establish a direction that warrants monitoring.
Company Overview
Snap-on is a 105-year-old manufacturer and distributor of premium professional tools, diagnostics equipment, repair information software, and related financial services. The company operates through four segments: Snap-on Tools Group (~38% of revenue, mobile van distribution to auto technicians), Repair Systems & Information Group (~36%, diagnostics and software for repair shops and OEM dealers), Commercial & Industrial Group (~24%, tools and equipment for aerospace, military, energy, and transportation), and Financial Services (~8% of revenue but ~21% of operating earnings).
The company operates in 130+ countries with approximately 13,000 employees and 36 manufacturing plants worldwide. Its ~4,700 franchised mobile van routes (3,400 in the U.S.) create a direct distribution channel to technicians at their place of work — a model Snap-on pioneered and no competitor has replicated at equivalent scale. The captive finance arm provides installment lending at 17.6% average yields, subsidizing tool purchases and reinforcing the distribution moat.
This publication is for informational and educational purposes only and does not constitute financial, investment, or trading advice. The analysis, opinions, and commentary presented here should not be interpreted as a recommendation to buy, sell, or hold any security. Always conduct your own research and consult a qualified financial advisor before making investment decisions. Past performance does not guarantee future results.
Financial Analysis
Balance Sheet: Snap-on’s balance sheet is among the strongest in the industrial sector. Current ratio of 4.79x, debt-to-equity of 0.41x, Altman Z-Score of 4.07, and $1.62B in cash against $1.19B in long-term debt (all fixed-rate, with maturities in 2027, 2048, and 2050). The $900M revolving credit facility is fully undrawn. This is a company that could weather a severe recession without accessing external capital.
Profitability: FY2025 operating margin of 25.8% and net margin of 20.2% are exceptional for an industrial manufacturer. ROA of 12.4% and ROE of 17.6% reflect high returns on a conservatively structured capital base. Both margins contracted modestly from FY2024 (operating margin down 50 bps, gross margin down 20 bps), driven by rising operating expenses for brand-building and personnel, alongside unfavorable currency effects.
Cash Flow: Free cash flow of $1.006B on $5.16B in revenue represents a 19.5% FCF margin. Capital expenditures of just $76M (1.5% of revenue) reflect Snap-on’s capital-light manufacturing model. Operating cash flow declined from $1.22B to $1.08B, driven by working capital investment ($82M inventory build, partially tariff-related pre-buying) and modestly lower earnings.
Capital Allocation: The company returned $791M to shareholders in FY2025 ($462M dividends + $329M buybacks), representing 79% of FCF. The 14% dividend increase to $9.76 annualized extends a streak of consecutive quarterly dividends dating to 1939. Share repurchases averaged $333/share — below the current price. $260M remains authorized.
Financial Services Detail: The $2.4B receivables portfolio yields 17.6% on finance receivables and 9.1% on contract receivables. Originations declined 5.2% to $1.12B — the first notable deceleration. The allowance ratio rose to 3.75% from 3.63%. This segment produces $282M in operating earnings at a 68.2% margin, making it the highest-margin contributor by far. Its health is a leading indicator for the broader business.
Growth Analysis
Snap-on’s consolidated organic growth of +0.3% in FY2025 is the core issue. Revenue has plateaued near $5.1-5.2B for three consecutive years:
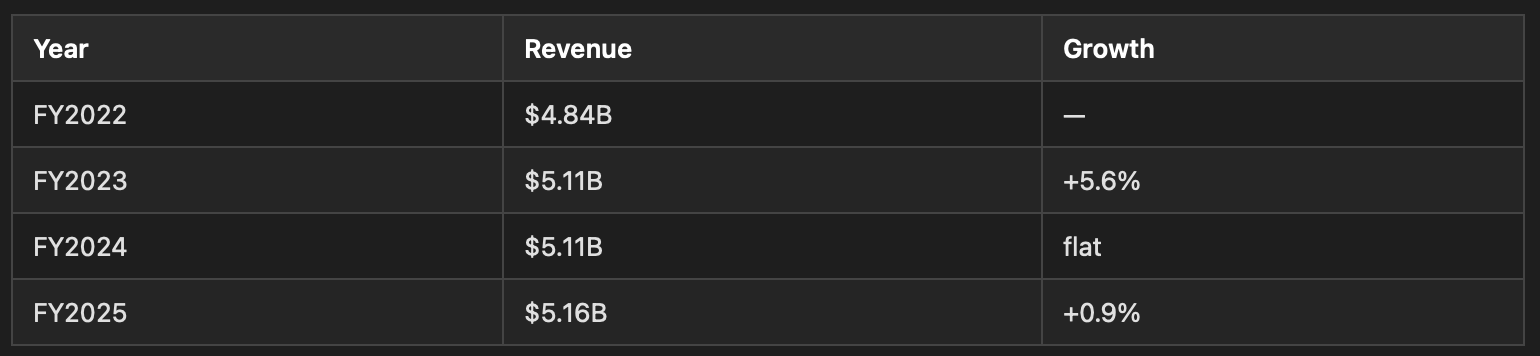
The segment-level picture provides more useful information:
RS&I (+3.9% organic, 26.7% margin, +140 bps): The clear growth driver. Double-digit activity with OEM dealerships, 8.2% growth in diagnostics/information products. Rising vehicle complexity (ADAS calibration, EV battery diagnostics, OEM-specific repair requirements) creates structural demand. Mitchell1, Dealer-FX, and Cognitran provide recurring software revenue with high switching costs.
Tools (-1.2% organic): U.S. technician spending declined at a low single-digit rate. International gained modestly. This is a mature, replacement-demand business with limited organic growth potential absent new technician hiring or tool innovation cycles.
C&I (-2.1% organic): Asia Pacific declined mid single digits; European hand tools declined low single digits. Critical industries (aerospace, military) provided partial offset. The $15.9M building sale and trademark retirement suggest management is rationalizing this segment’s footprint.
The growth thesis rests on RS&I continuing to outperform and eventually pulling consolidated growth higher. Management’s references to using AI to “accelerate expansion” in software solutions and the structural tailwind from increasing vehicle complexity support this view. There is no near-term catalyst for a re-acceleration in the Tools or C&I segments.
Valuation Assessment
At $381, Snap-on trades at approximately 19.8x forward earnings (using the $19.25 consensus implied by the forward P/E) and 19.8x trailing EPS of $19.19. Against the peer group:
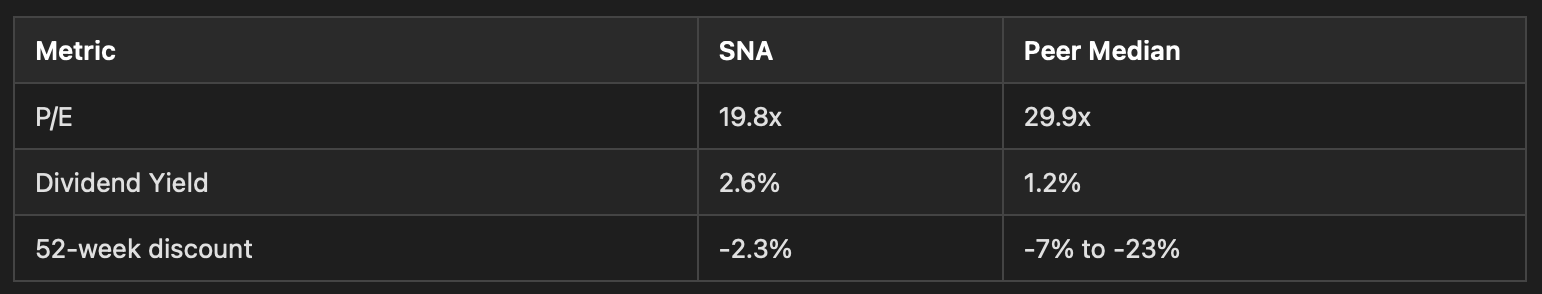
The 34% P/E discount to peers (Fortive 37.5x, Nordson 29.9x, IDEX 31.3x, Pentair 22.6x, Stanley Black & Decker 25.8x) is the widest in this comp set. Snap-on’s operating margins exceed all named peers, and its balance sheet metrics are superior. The discount reflects: (1) near-zero organic growth vs. peers with more visible growth pathways, (2) four consecutive earnings misses, and (3) limited sell-side enthusiasm (4 Holds, 2 Strong Buys, 2 Buys, 2 Strong Sells among 10 analysts).
The analyst consensus target of $376 (mean) to $391 (median) is essentially at the current price, with a range of $294-$445. The median target implies no upside, typical of a mature-value stock where the Street sees no re-rating catalyst.
At ~19.8x earnings with a 2.6% dividend yield, Snap-on prices in zero growth. If RS&I-driven growth resumes even at low single digits (+2-3% consolidated), a re-rating toward 22-24x forward earnings would produce meaningful upside ($425-460 range). The downside case at the analyst low of $294 (-23%) assumes a recession-driven earnings decline to ~$16-17/share, which would require a significant deterioration in both product demand and the credit portfolio simultaneously.
Competitive Landscape
Snap-on’s competitive position is anchored by three mutually reinforcing advantages:
1. Franchise Distribution Network: The ~4,700 mobile van routes represent the only scaled direct-to-technician distribution channel in the industry. Matco Tools (Danaher) and Mac Tools (Stanley Black & Decker) operate smaller competing networks, but Snap-on’s ~3,400 U.S. routes dwarf both. The weekly in-person visit model creates relationships and impulse purchasing dynamics that e-commerce cannot replicate for high-consideration professional tools.
2. Captive Finance: The high-yield lending operation makes high-priced tools affordable through installment plans and simultaneously locks in customer retention. Competitors without captive finance face a structural disadvantage in selling premium-priced items to technicians who earn median incomes of $50-60K.
3. Repair Software & Data: RS&I’s portfolio (Mitchell1, Dealer-FX, Cognitran) creates recurring revenue and OEM relationships that drive equipment and tool pull-through. As vehicle complexity increases, repair shops and dealerships become more dependent on Snap-on’s diagnostic and information platforms. Switching costs are high.
The EV transition is a net neutral to modest positive. Reduced traditional maintenance (oil changes, exhaust systems) is offset by new requirements: ADAS calibration, high-voltage battery diagnostics, EV-specific tooling, and more complex repair information requirements. The RS&I segment’s 8.2% growth in diagnostics/information products suggests the transition is already creating incremental demand.
Risk Assessment
Technician Spending Weakness: The Tools Group organic decline combined with the drop in finance receivable originations indicates technicians are pulling back on discretionary tool purchases. If this reflects early-cycle behavior ahead of a broader slowdown in vehicle miles traveled or repair activity, both product revenue and the credit portfolio could deteriorate simultaneously. A move in the allowance rate above 5% would signal meaningful credit deterioration.
Tariff Environment: While the domestic manufacturing footprint provides structural insulation, the company acknowledged $82M in inventory pre-buying related to trade uncertainty. If tariffs escalate further or supply chains require restructuring, the cost advantage could narrow. Management’s characterization of “extraordinary turbulence” in Q4 FY2025 suggests this is an active concern.
CEO Succession: Nicholas Pinchuk has been CEO since 2007 (18+ years) and is approximately 75+ years old. His $323M personal equity stake ensures alignment, but there is no public succession plan. A poorly managed transition could disrupt the company’s culture and strategic direction. The prior score trajectory flagged a Management Quality decline (7.5 → 5.5), partially reflecting this risk.
Consumer/Recession Sensitivity: Despite serving professional markets, Snap-on is correlated with auto repair activity, which in turn correlates with vehicle miles traveled and consumer spending on vehicle maintenance. A recession that reduces driving or causes vehicle owners to defer repairs would pressure both the Tools and RS&I segments. The current macro environment (50-55% recession probability, record-low consumer sentiment) makes this a live risk.
Earnings Miss Pattern: The four consecutive quarterly misses (ranging from -1.2% to -5.1%) indicate a pattern of management over-promising or consensus over-estimating. While these are older data points, the pattern suggests estimates may need further revision.
Options Market Signal
Near-term implied volatility of 31.7% sits 10.9 percentage points above 1-year historical volatility of 20.8%, placing SNA options in the 67th percentile of richness within the current chain. The term structure is in backwardation (31.7% near-term → 20.8% at 6 months), indicating the market is pricing a specific near-term catalyst or elevated uncertainty. The 5.9% put skew at the 1-month tenor confirms modestly elevated downside hedging demand. The implied move of ±6.9% to nearest expiry ($355-$408 range) suggests the market expects volatility around the next earnings report or macro developments. This options signal is consistent with a stock where the market sees near-term uncertainty but not structural distress.
