
PPI Surges to 6% as Inflation Pipeline Overwhelms Policy Options; Jensen Huang's Beijing Invitation Reshapes Summit Odds
The IEA's confirmation of a 1.8 Mbpd structural oil deficit and Saudi covert strikes on Iran eliminate any remaining path to disinflation without demand-destroying recession

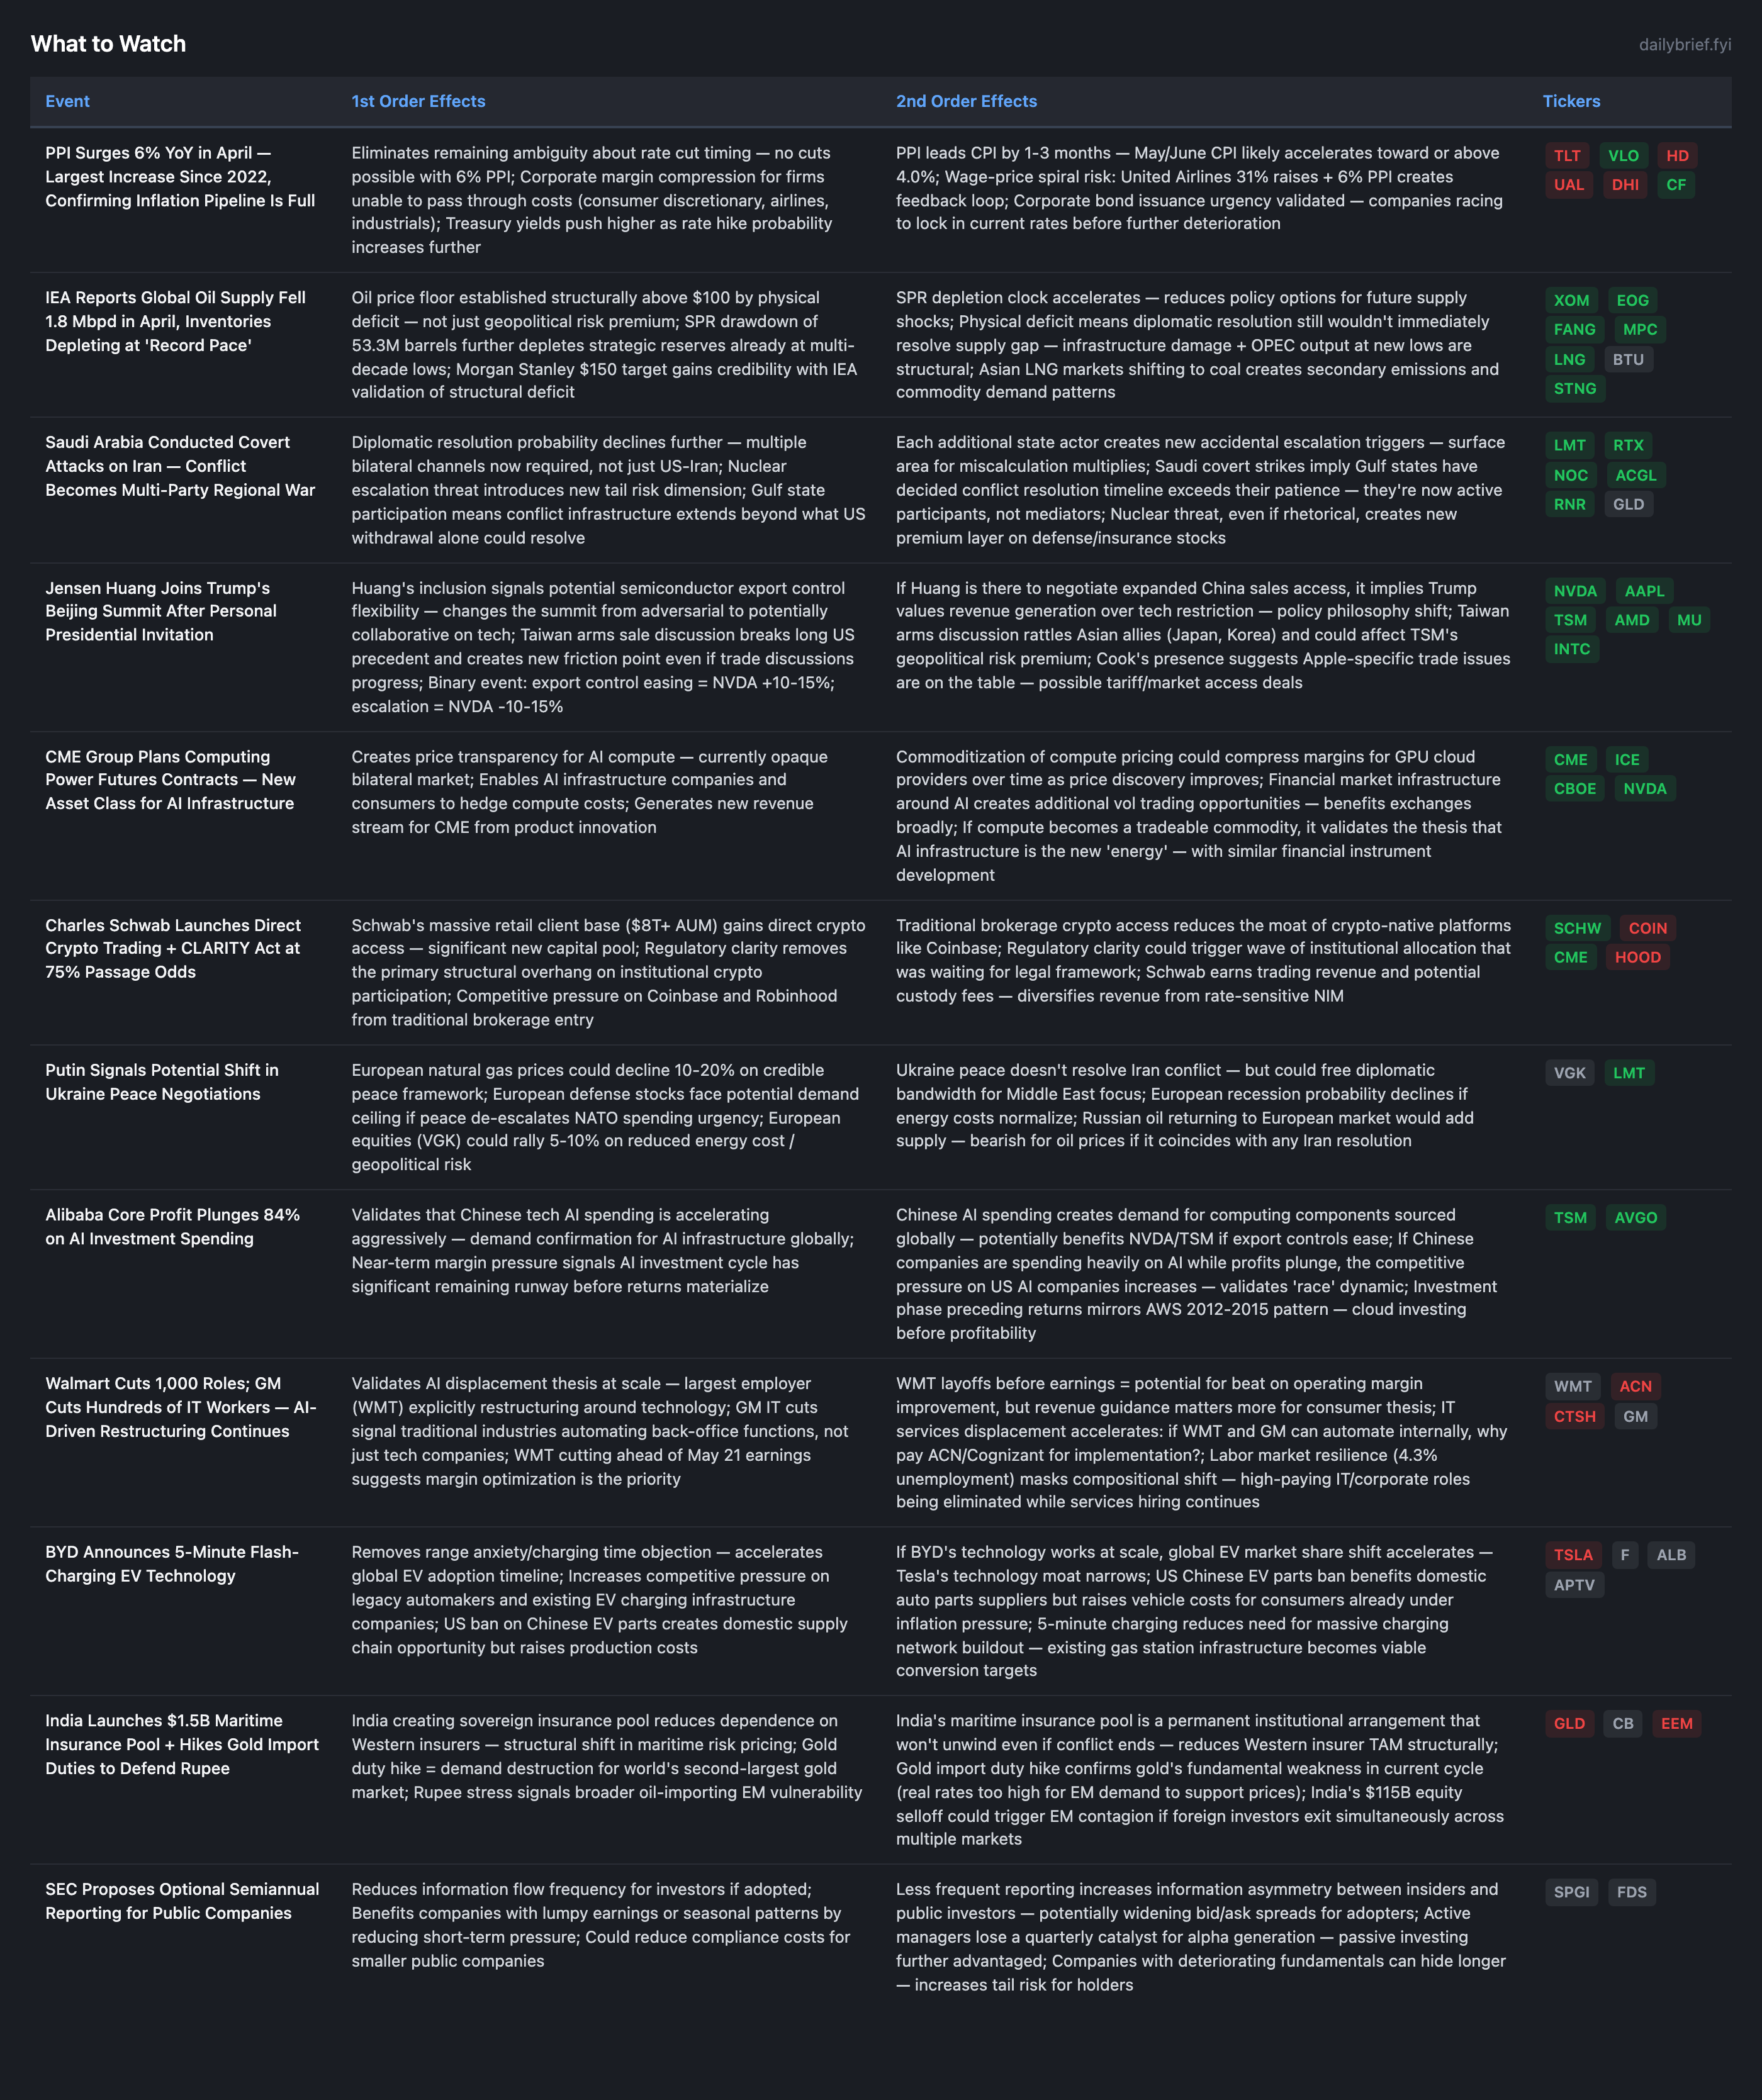
Two developments since the May 12 brief shift the landscape: (1) April PPI at 6% YoY — the largest increase since 2022 — confirms that the inflation pipeline is accelerating, placing the H2 CPI trajectory firmly on track for 4.5-5.0% or higher; and (2) Jensen Huang’s personal inclusion in the Trump-Xi Beijing summit alters the binary risk profile of Wednesday’s event from primarily adversarial to potentially collaborative on semiconductor export controls.
The IEA’s May report quantifying a 1.8 Mbpd supply decline and “record pace” inventory depletion validates the oil structural deficit thesis with the highest-credibility institutional source available. Saudi Arabia’s covert attacks on Iran (Reuters exclusive) add a fifth state actor to the conflict, confirming the multi-party regional war framework and reducing diplomatic resolution probability to 5-8%. The combination of PPI 6% + IEA structural deficit + multi-party conflict expansion eliminates any remaining scenario where inflation subsides in 2026 without a recession deep enough to destroy demand.
New Developments
PPI 6% YoY: The Inflation Pipeline Accelerates Beyond Oil
The April PPI at 6% annual and 1.4% monthly is the single most important new data point since the CPI release. PPI leads CPI by 1-3 months through producer cost passthrough. Combined with CPI at 3.8% and Core PCE at 3.2%, the inflation progression is: producer costs rising at 6% → consumer prices currently at 3.8% → H2 consumer prices likely 4.5-5.0% as passthrough materializes.
The FT explicitly notes this is the biggest PPI increase since Russia’s Ukraine invasion — the prior comparison point for an energy-driven supply shock feeding through to broad inflation. The critical difference: in 2022, the Fed was actively hiking from near-zero. Today the Fed is at 3.50-3.75% with a new Chair taking office, no rate cuts possible, and markets now pricing rate hikes by year-end at 34% (Kalshi) and by June 2027 at 43%.
The broadening beyond energy is confirmed: CNBC reports shelter and food prices “also rising fast.” Once inflation broadens into services and shelter, it becomes self-reinforcing through wage expectations (United Airlines 31% raises are exhibit A).
Jensen Huang’s Inclusion Changes the Trump-Xi Summit Risk Profile
The prior brief’s world model listed Huang’s exclusion from the delegation as evidence of reduced breakthrough probability and assigned 8-12% to a comprehensive deal. His personal invitation by Trump changes this assessment. Three possibilities:
Huang is there to negotiate expanded China sales access (40-50% probability of being the reason). This implies Trump values semiconductor revenue generation and uses export control relaxation as a bargaining chip for concessions on Iran/trade. Bullish for NVDA/AMD/MU.
Huang is there for optics while substantive restrictions remain (30-40%). CEOs provide photo-op legitimacy without policy change. Neutral outcome.
Huang’s presence creates a framework for formalized chip-for-cooperation exchange (10-20%). China agrees to pressure Iran on Hormuz in exchange for defined semiconductor access. This would be the comprehensive deal scenario — oil crashes, tech rallies, EM stabilizes.
The change from “Huang excluded” to “Huang personally invited by president” shifts the summit outcome distribution away from pure escalation toward at least moderate outcomes. QQQ 30.3% 1-week IV still prices extreme near-term uncertainty, suggesting the options market hasn’t fully adjusted to this development.
IEA Confirms Structural Supply Deficit
The IEA stating supply will “fall below demand this year” with inventories depleting at “record pace” transforms the oil thesis from geopolitical risk premium to physical market deficit. This distinction matters because:
Geopolitical risk premium = can evaporate on diplomatic signal (as it did May 6 when oil crashed 11% on peace deal announcement)
Physical deficit = persists regardless of diplomatic rhetoric because infrastructure damage ($58B per Rystad) and OPEC output at new lows are structural
The US loaning 53.3M barrels from the SPR confirms the administration recognizes the physical tightness. Per the world model’s analyst lesson: SPR depletion clocks, not spot price, determine supply-disrupted oil market direction. Each drawdown reduces the buffer available for future shocks.
Saudi Covert Attacks on Iran: Fifth State Actor Enters Conflict
Reuters’ exclusive report on Saudi covert operations against Iran joins UAE (WSJ), Kuwait (drone intercepts), Qatar (vessel attacks), and the US as confirmed conflict participants. Iran’s nuclear enrichment threat represents a qualitative escalation dimension not previously priced.
Each additional state actor creates bilateral relationship pairs that must all be resolved for peace. With 5 actors, there are now 10 bilateral relationships (C(5,2)=10) that need alignment versus the 1 bilateral (US-Iran) that was the original conflict. Diplomatic resolution probability declines to 5-8%.
Developing Themes
Rate Path: PPI 6% Upgrades Hike Probability
The prior brief assigned 30-40% probability to a rate hike in 2026. PPI at 6% arriving one day after CPI at 3.8% creates the data environment where hiking becomes defensible. Warsh taking office May 15 with this inflation backdrop has two choices: (a) signal hawkish intent immediately to establish credibility, or (b) wait for June FOMC data. Either way, rate cuts are eliminated from discussion. Bank of America’s H2 2027 cut estimate now appears optimistic rather than cautious.
Credit-Equity Disconnect: HYG P/C Volume at 46.95x
Today’s options data shows HYG P/C volume ratio at 46.95x — further extreme from yesterday’s 37.09x. OI P/C at 6.25x is down slightly from 6.93x, suggesting the volume spike represents new positioning rather than closing of existing positions. The world model’s “5-10 trading days to spread movement” window is now 1 day old. Spread still at 2.79% (unchanged from FRED data). The gap between positioning and pricing remains at maximum historical divergence.
Trump-Xi Summit: Wednesday Binary Event — Recalibrated
With Huang included, the probability distribution shifts:
Comprehensive deal including Iran pressure: 10-15% (up from 8-12%)
Export control relaxation without broader deal: 20-25% (new scenario)
Moderate outcome / photo-op: 40-50% (adjusted)
Escalation with export control retaliation: 15-20% (down from 20-25%)
The asymmetry has shifted: upside scenarios are now more probable than downside scenarios for the tech complex specifically, though broader geopolitical/Iran outcomes remain uncertain.
Continuing Themes
Iran conflict: 5 confirmed state actors (US, Iran, UAE, Saudi, Kuwait). Ceasefire “on life support.” Diplomatic resolution 5-8%. No change to energy overweight thesis.
Consumer deterioration: May 19-21 earnings (HD, TGT, WMT) approach with PPI 6% confirming margin compression. WMT cutting 1,000 ahead of report. Worst configuration of cycle.
AI demand: Q1 earnings confirmed spending dominance. Alibaba -84% core profit from AI investment validates global spending acceleration. Nebius revenue boom confirms infrastructure thesis. 8+ independent demand confirmations.
Gold: India duty hike (10% + 5%) on gold imports confirms demand destruction for world’s #2 market. Exit remaining longs confirmed by fundamental + options signals.
What to Watch
The options landscape beneath these events reveals positioning that demands attention: HYG put/call volume has surged to 46.95x — up from 37.09x yesterday — while credit spreads remain flat at 2.79%, creating maximum historical divergence between protection demand and realized spreads. FXI is showing a 0.01 put/call volume ratio (pure call buying) ahead of Wednesday’s summit, while TLT 3-month puts are trading at 9.94x volume/open interest as institutions position for Warsh’s first policy signals. The 5-10 day window for credit spread repricing opened May 12 — execution timing for protection and positioning around Wednesday’s binary event is now the critical variable. Full options positioning analysis, portfolio playbook, and risk scenario framework below for subscribers.
This publication is for informational and educational purposes only and does not constitute financial, investment, or trading advice. The analysis, opinions, and commentary presented here should not be interpreted as a recommendation to buy, sell, or hold any security. Always conduct your own research and consult a qualified financial advisor before making investment decisions. Past performance does not guarantee future results.
