
Oil Reclaims $100 as Hormuz Seizures Shatter Ceasefire Illusion; Enterprise Software Shows First Earnings Damage from Iran Conflict
Bond investors crowd into steepener trades as 30-year yields approach 5% and a weak 2-year auction signals deteriorating Treasury demand.

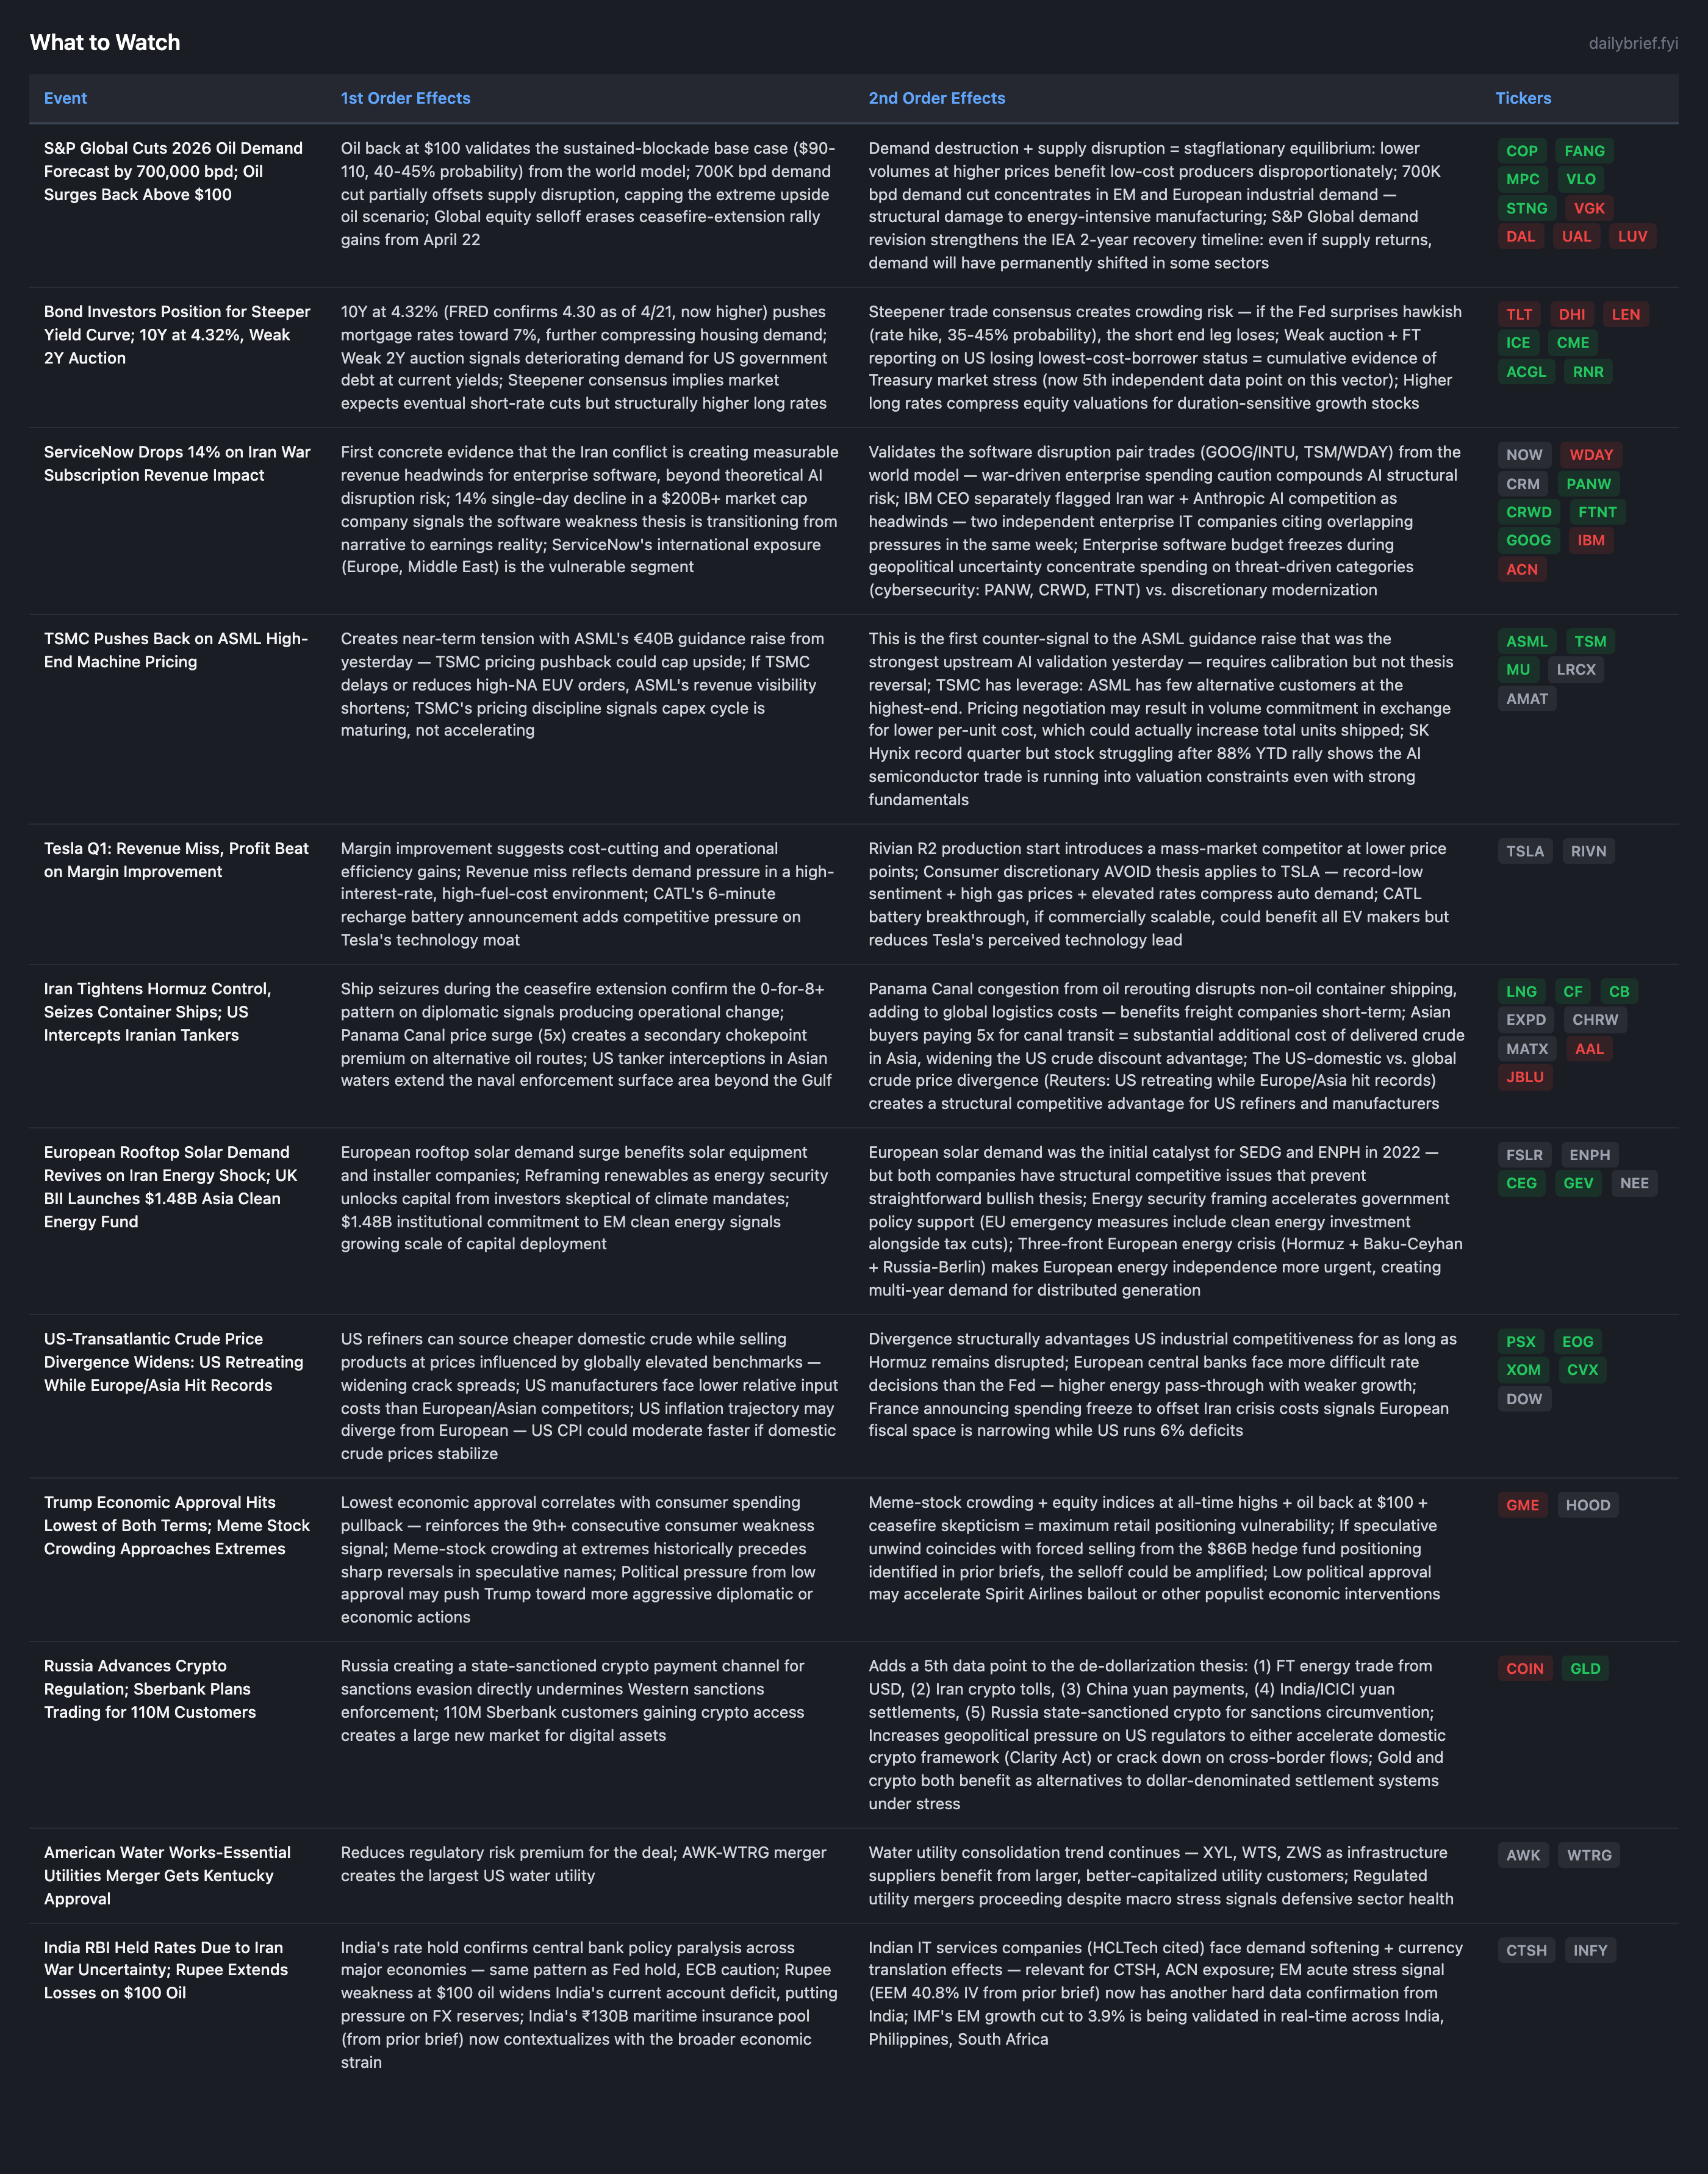
Oil surged back above $100 on April 23, erasing the ceasefire-extension rally within 24 hours. Iran seized container ships in Hormuz, the US intercepted three Iranian tankers in Asian waters, and Panama Canal transit bids hit 5x pre-conflict levels as Asian buyers scrambled for western crude. The ceasefire pattern holds: 0-for-9 on diplomatic signals producing operational change. S&P Global’s 700K bpd demand cut partially offsets supply disruption but the net effect remains stagflationary — lower volumes at higher prices.
Three developments shifted since yesterday. First, the US-transatlantic crude price divergence widened materially, with US crude prices retreating while European and Asian benchmarks hit fresh records (Reuters, Tier 1). This creates a structural US competitive advantage for refiners and manufacturers that persists as long as Hormuz is disrupted. Second, ServiceNow’s 14% drop on Iran-war subscription revenue impairment — corroborated by IBM’s CEO flagging identical headwinds — provides the first hard evidence that the conflict is creating measurable enterprise software revenue damage, validating the software disruption pair trades. Third, bond investors are positioning aggressively for curve steepening, with the 10Y at 4.32%, 30Y approaching 5%, and a weak $69B 2-year auction, signaling deteriorating Treasury demand alongside persistent inflation expectations.
US-Global Crude Price Divergence: Structural Competitive Advantage Emerging
Reuters reports (Tier 1) that US crude cargo prices have retreated from recent spikes while European and African crude prices hit fresh records. FT reports Panama Canal transit bids at 5x pre-conflict levels as Asian buyers seek western crude. This divergence reflects ample US domestic supply acting as a buffer that no other major economy possesses.
US refiners (MPC, VLO, PSX) can source cheaper domestic crude while selling products at prices influenced by globally elevated benchmarks. Crack spreads widen mechanically. US manufacturers face lower relative input costs than European competitors. FRED data shows March CPI at 330.29, rising — but US inflation may moderate faster than European inflation if domestic crude stabilizes, creating a policy divergence between the Fed and ECB.
France announcing a spending freeze to offset Iran crisis costs, while Germany’s GDP forecast is halved to 0.5%, confirms the three-front European energy crisis is producing fiscal and growth consequences faster than expected. European recession probability exceeds 60% within 6 months.
ServiceNow + IBM: Enterprise Software Revenue Impairment from Conflict
ServiceNow’s 14% single-session decline after citing Iran-war subscription revenue impairment is the first concrete earnings evidence that the conflict is damaging enterprise software revenue. IBM’s CEO separately flagged Iran war plus Anthropic AI competition as dual headwinds in the same earnings week. Two independent enterprise IT companies citing overlapping pressures constitutes an early pattern (2 data points) rather than an isolated incident.
This validates the software disruption thesis and strengthens pair trades that are long hardware/infrastructure (GOOG, TSM) against enterprise SaaS (WDAY, INTU). Enterprise software budget freezes during geopolitical uncertainty concentrate spending on threat-driven categories (cybersecurity: PANW, CRWD, FTNT) vs. discretionary modernization (ServiceNow, Workday, Salesforce). If a best-in-class name like ServiceNow is impaired, weaker peers face worse relative outcomes.
Yield Curve Steepening: Treasury Market Sending Growth Warning
Bond investors are positioning for a steeper curve (Reuters/WSJ, Tier 1), going long short-dated Treasuries and short long-dated bonds. The 10Y yield at 4.32% (FRED: 4.30 as of 4/21, now higher) and 30Y approaching 5%, combined with a weak $69B 2-year auction, signal deteriorating demand for US government debt.
The steepener consensus reflects expectations for slower growth (supporting short-end) while persistent inflation from the energy shock plus heavy government debt issuance keep long yields elevated. FRED data shows the 10Y-2Y spread at 0.51% as of April 22, down 1bp — but the trend is toward steepening as the front end rallies relative to the long end. This adds a 5th independent data point to the Treasury market stress vector (political: Powell probe, institutional: Paulson plan, market-based: FT lowest-cost-borrower status, leadership: Tillis blocking Warsh, and now weak auction demand).
Mortgage rates approaching 7% in the spring selling season will compress housing demand. FRED shows existing home sales already at 3.98M (down 150K), and further rate increases will accelerate the decline.
S&P Global Oil Demand Cut: Stagflationary Equilibrium Forming
S&P Global’s 700K bpd demand revision is the first major forecaster to quantify war-driven demand destruction (Reuters, Tier 1). Combined with the IEA’s 2-year supply recovery timeline, this points toward a stagflationary equilibrium: supply constrained by infrastructure destruction, demand constrained by price levels, with the price clearing somewhere in the $90-110 range — the world model’s base case at 40-45% probability.
The demand cut concentrates in EM and European industrial consumption. Low-cost US producers (COP, FANG, EOG) benefit disproportionately because they maintain volumes while high-cost competitors face demand destruction and elevated input costs simultaneously. The $430M oil short placed ahead of the ceasefire extension (Reuters) is now losing money as oil reversed above $100.
Russia Crypto Legislation: 5th De-Dollarization Data Point
Russia’s Duma advancing comprehensive crypto legislation with explicit provisions for sanctions circumvention, and Sberbank planning crypto trading for 110M customers, adds a 5th independent data point to the de-dollarization thesis. The prior four: (1) FT energy trade migration from USD, (2) Iran crypto tolls, (3) China yuan payments, (4) India/ICICI yuan settlements. Russia’s state-sanctioned crypto channel is qualitatively different because it represents deliberate government policy to create dollar-bypass infrastructure, not merely opportunistic trading. This strengthens the structural gold thesis (GLD).
Developing Themes
ASML Counter-Signal: TSMC Pricing Pushback. TSMC reportedly pushing back on ASML’s high-end machine pricing (MarketWatch, Tier 2) is the first counter-signal to yesterday’s €40B guidance raise and €12B buyback. One counter-signal vs. strong earnings, guidance raise, and management buyback commitment. The AI infrastructure thesis remains intact, but this signal warrants monitoring: if TSMC delays high-NA EUV orders, ASML’s revenue visibility shortens. SK Hynix’s record quarter but stock struggling after 88% YTD rally shows the AI semiconductor trade is running into valuation constraints even with strong fundamentals.
Airlines Approaching Breaking Point. Spirit Airlines nearing a $500M government bailout, TUI cutting profit guidance, United Airlines warning on fuel margins, and EU implementing emergency jet fuel allocation controls collectively signal structural airline industry stress. $100 oil translates to $100+/flight fuel cost additions. This is the 3rd consecutive brief with airline stress signals accumulating. The European jet fuel physical shortage flagged in the world model (~3-4 weeks) appears to be materializing as the EU implements emergency allocation controls.
Consumer Contraction: 10th Consecutive Signal. Trump’s economic approval hitting lowest of both terms (CNBC), JPMorgan’s meme-stock crowding warning, March retail sales driven entirely by gasoline (+15.5%), and LVMH CEO Arnault warning of “world catastrophe” extend the consumer weakness pattern to a 10th consecutive signal. Michigan sentiment at 56.6 (FRED, Feb data — likely lower in April given subsequent deterioration).
Warsh Confirmation and Fed Governance. No material new information beyond yesterday’s hearing analysis. Warsh committed to inflation-first mandate. Tillis block persists. Rate path unchanged: 35-45% hike, 3-5% cut, 52-60% no action.
Continuing Themes
Iran conflict: Ceasefire operationally irrelevant for the 9th time. Ship seizures continue during nominal ceasefire. Three-front European energy crisis persists. All structural energy/fertilizer/defense/insurance positions maintained.
Credit cascade: HYG OI P/C at 4.42 (slightly moderated from 4.55 yesterday). $14B HY outflows. BDC NAV marks approaching in May. Probability unchanged at 65-75%.
Defense: Awaiting LMT Q1 earnings as sector valuation anchor. Germany military strategy + Japan warship export + US dual-theater all confirmed.
Gold: Past $4,900. 5th de-dollarization data point from Russia crypto legislation. GLD options in backwardation but near-term IV (24.7%) actually below HV (27.5%) — structurally cheap.
What to Watch
The options market is sending a deeply conflicted signal beneath the surface calm. HYG 1-week put skew surged to 59.5% — the most extreme credit protection reading of the entire conflict — even as large-cap equity vol normalizes for the 5th time (SPY near-term IV collapsed to 14.7%, just 2.1pp above realized). Gold options at 24.7% near-term are structurally cheap, sitting 2.8pp below realized volatility with 5 de-dollarization data points supporting the thesis. Meanwhile, FXI near-term IV jumped from 22.2% to 27.6% — a genuinely novel signal suggesting China may be losing its energy-insulated position. The premium section below breaks down exactly how these signals translate into portfolio positioning, where to add US refiner exposure on the transatlantic divergence, and why the credit event probability framework points to BDC NAV marks in May as the next catalyst. Full options positioning analysis, portfolio playbook, and risk scenario framework below for subscribers.
This publication is for informational and educational purposes only and does not constitute financial, investment, or trading advice. The analysis, opinions, and commentary presented here should not be interpreted as a recommendation to buy, sell, or hold any security. Always conduct your own research and consult a qualified financial advisor before making investment decisions. Past performance does not guarantee future results.
