
Investment Research Report: TechnipFMC plc (FTI)
With EBITDA margins more than doubling since 2021 and nearly two years of locked-in revenue, TechnipFMC's proprietary iEPCI model has created genuine switching costs that justify a premium to OFS peer

Executive Summary
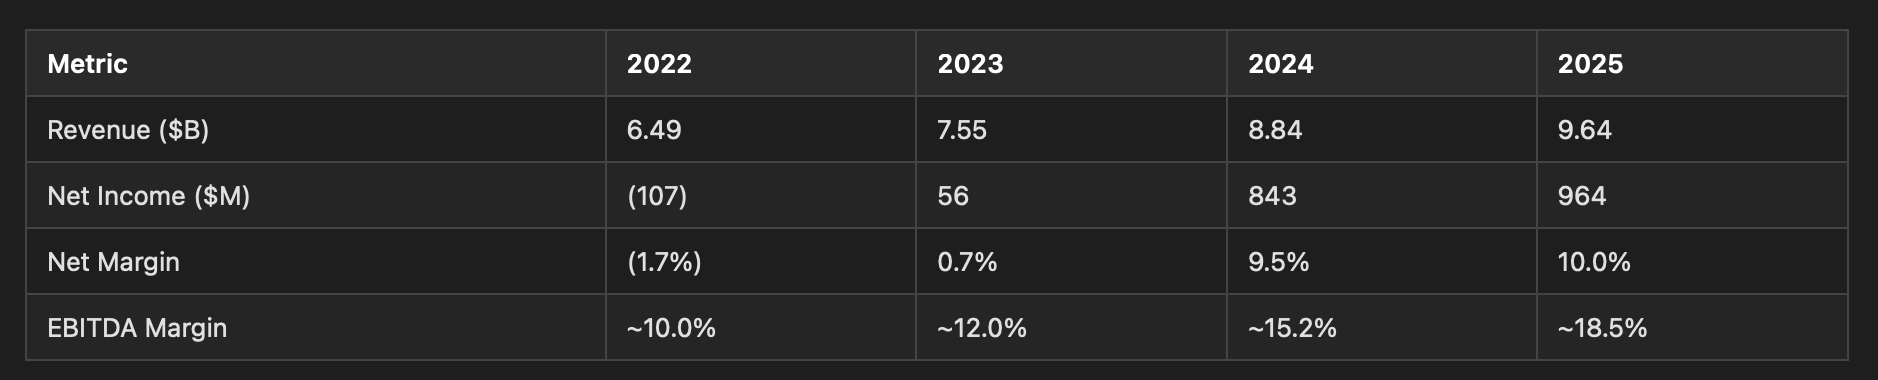
TechnipFMC is the world’s largest subsea equipment and services company, operating at the center of a deepwater capital spending upcycle with multi-year duration. EBITDA margins have more than doubled from 8.8% in 2021 to 18.5% in 2025, driven by the proprietary iEPCI (integrated engineering, procurement, construction, installation) model and Subsea 2.0 configure-to-order platform. Revenue grew from $6.5B in 2022 to $9.6B in 2025 while net income swung from a $(107M) loss to $964M. The balance sheet has shifted to a net cash position of $439M, and the company carries an investment-grade rating from all three agencies.
The $16.8B backlog (up 17% in the first nine months of 2025 alone) provides roughly two years of revenue visibility at current run rates, with 88% converting beyond the current fiscal year. Management expects $10B+ in new Subsea orders in 2026. The company is returning at least 70% of free cash flow to shareholders through a $2.3B remaining buyback authorization and a modest dividend. The stock has appreciated 191% over the trailing twelve months and trades at ~31x trailing EPS, in line with the OFS peer median, but the underlying business quality — structural margin expansion, net cash, dominant competitive position, multi-year backlog — justifies a premium. At ~20-22x FY2026 estimated earnings (accounting for continued margin expansion and buyback-driven share count reduction), the stock remains attractive with a base case target of $83-85.
This publication is for informational and educational purposes only and does not constitute financial, investment, or trading advice. The analysis, opinions, and commentary presented here should not be interpreted as a recommendation to buy, sell, or hold any security. Always conduct your own research and consult a qualified financial advisor before making investment decisions. Past performance does not guarantee future results.
Company Overview
TechnipFMC was formed in 2017 from the merger of Technip SA and FMC Technologies. Incorporated in the UK and headquartered in Houston, the company operates through two segments:
Subsea (~87% of revenue): Designs, manufactures, and installs subsea production systems, umbilicals, risers, and flowlines for offshore oil and gas development. The segment’s competitive advantage centers on two proprietary models: (1) iEPCI, which integrates scope previously split across 3-4 contractors into a single fixed-price contract, reducing total project cost and schedule by approximately 25%; and (2) Subsea 2.0, a pre-engineered platform that compresses delivery to 12 months and cuts product cost by up to 25%. iEPCI now represents roughly one-third of the addressable subsea market.
Surface Technologies (~13% of revenue): Wellhead systems and pressure control equipment for onshore and offshore completions. Over 60% of segment revenue is international (Middle East, North Sea, Asia Pacific), limiting US land cycle exposure to approximately 5% of total company revenue.
Geographic revenue concentration: Brazil (36% of Subsea), Europe/Central Asia (26%), Africa (14%), and a fast-growing Israel position ($179M in 9M 2025, up from $2.8M prior year).
Financial Analysis
Revenue and Profitability
Revenue compounded from $6.49B (2022) to $9.64B (2025), a 14.2% CAGR over three years. Growth is entirely Subsea-driven: Subsea revenue grew 12.1% YoY in the first nine months of 2025 ($6.47B vs. $5.77B), while Surface Technologies was flat at $944M.
The profitability trajectory is the core of the investment case:
Subsea operating margins expanded 340 bps YoY in 9M 2025 (15.9% vs. 12.5%), driven by volume leverage ($143M contribution) and favorable activity mix ($176M contribution). Q3 2025 Subsea margins hit 17.3%, up from 14.2% a year earlier. This expansion is structural — driven by Subsea 2.0 manufacturing efficiency and iEPCI scope consolidation — rather than merely cyclical.
Cash Flow and Balance Sheet
Operating cash flow surged from $382M (9M 2024) to $1,311M (9M 2025), a 3.4x improvement. Contract liabilities (customer advance payments) increased $602M to $2,389M, reflecting the company’s negotiating leverage and the front-loaded cash profile of the growing backlog. Annual capex runs approximately $317M (~3.3% of revenue), implying annualized free cash flow above $650M.
Balance sheet details:
Total debt: $438M (down from $1.05B in 2022)
Cash: $877M
Net cash: $439M
Investment-grade rated by all three agencies (S&P BBB-, Fitch BBB-, Moody’s Baa2)
$1.25B revolving facility fully available
$1.0B commercial paper program established June 2025
Capital returns have been substantial: $1,456M in cumulative buybacks since July 2022, including $750M in the first nine months of 2025. The $2.0B additional authorization from October 2025 brings remaining capacity to approximately $2.3B, or roughly 16% of outstanding shares at the time of authorization.
Earnings Surprise Track Record
The company has beaten consensus EPS estimates in 3 of the last 4 quarters, with the most recent quarter (Q4 2025) delivering $0.70 vs. the $0.51 consensus — a 37.1% beat. The prior miss (Q1 2025: $0.33 actual vs. $0.35 estimate, -7.0%) was a minor seasonal shortfall. This pattern suggests consensus estimates may still be conservative, particularly as higher-margin backlog continues to convert.
Growth Analysis
Backlog Provides Multi-Year Visibility
Total backlog of $16.8B as of September 2025 ($16.0B Subsea, $0.8B Surface), up 17% from $14.4B at year-end 2024. Only 11.8% was expected to convert to revenue through the remainder of 2025, meaning 88.2% converts in 2026 and beyond. At the current revenue run rate, this represents nearly two years of locked-in work.
9M 2025 Subsea inbound orders totaled $7.72B, implying a book-to-bill ratio above 1.2x. Management guided to cumulative Subsea orders of $30B over the three years ending 2025 (>$10B/year average) and expects $10B+ in 2026. Key recent awards include bp Tiber (estimated $600-800M, 20,000-psi deepwater), TotalEnergies GranMorgu (first Suriname subsea development), Shell Sparta (first 20,000-psi iEPCI), and Petrobras Mero 3 HISEP (first iEPCI for Petrobras).
Margin Expansion Runway
The 340 bps YoY improvement in Subsea margins in 9M 2025 reflects both volume leverage and mix shift toward higher-margin iEPCI contracts. As the backlog — much of it booked at improving terms — converts over 2026-2027, further margin expansion is probable. Management’s ROIC of 19.5% exceeds industry averages and supports the trajectory.
Structural Deepwater Drivers
The growth thesis rests on secular forces: improved deepwater project economics (iEPCI and Subsea 2.0 reduce breakeven costs), new frontier discoveries (Namibia, Suriname, Guyana extensions), an aging installed base driving services demand, and energy security priorities sustaining conventional E&P capital allocation. These factors have been validated by the backlog trajectory and are less sensitive to near-term oil price volatility than onshore drilling activity.
Valuation Assessment
At $70.04, FTI trades at approximately 31x trailing EPS ($2.30) and 31x forward P/E per the profile data. The peer median P/E is 31.4x. FTI appears in line with peers on headline multiples, but its growth and margin profile are substantially superior:
Weatherford (16.7x) has lower growth and higher leverage
NOV (49.2x) trades at a premium on depressed earnings
Archrock (19.8x) is a compression services business with different dynamics
Kodiak Gas (69.9x) is a small-cap compounder at extreme multiples
Liberty Energy (31.4x) has direct US land exposure, the most cyclically vulnerable sub-segment
The analyst consensus median target is $69.00, with a range of $45.00 to $83.00. The current price of $70.04 is above the median target, suggesting either consensus targets are lagging the recent move or the analyst community sees limited additional upside. Given the 191% price appreciation over 12 months, target lag is likely.
A forward estimate approach is more useful. If FTI generates $3.30-3.50 in EPS in FY2026 (reflecting continued margin expansion toward 19-20% EBITDA margins, moderate revenue growth on backlog conversion, and share count reduction from buybacks), the stock trades at roughly 20-21x forward earnings. For a company with 2+ years of backlog visibility, a net cash balance sheet, structural competitive advantages, and demonstrated margin expansion, 22-25x forward earnings is defensible. At 24x $3.50 FY2026E EPS, fair value approximates $84.
The stock does not screen as cheap on trailing metrics. The valuation case rests entirely on forward earnings power, which depends on margin expansion and backlog conversion continuing as demonstrated. This is a reasonable assumption given the evidence, but it limits the margin of safety compared to a classic value setup.
Competitive Landscape
TechnipFMC has no direct peer of equivalent scale in integrated subsea. SLB’s OneSubsea joint venture with Aker Solutions is the primary competitive threat, but it lacks the same end-to-end integration that iEPCI provides. Baker Hughes competes in specific product areas (subsea trees, flexible pipe) without the EPCI integration.
The iEPCI model creates meaningful switching costs: once an operator designs a field development around integrated delivery, changing contractors mid-cycle is extremely costly and schedule-destructive. This is reflected in the backlog composition and the expanding share of iEPCI in TechnipFMC’s order book.
The company’s TSR of 649% over the proxy measurement period versus 182% for its peer group is an objective measure of competitive and operational superiority during this cycle.
Surface Technologies faces more conventional competition (Cameron/SLB, Dril-Quip, Weir) but is a small and declining share of the business.
Risk Assessment
Oil Price Sensitivity: Sustained oil below $60/bbl would slow FID activity and reduce future order intake beyond the current backlog’s protection window. The current Hormuz-related conflict has driven oil volatility but has also reinforced energy security investment themes that support deepwater spending.
Fixed-Price Execution Risk: iEPCI contracts are predominantly fixed-price, creating exposure to cost overruns and schedule delays. Warranty accruals rose from $68M to $95M in 9M 2025. A single project blowup could compress margins significantly in a given quarter.
Geographic Concentration: Brazil (Petrobras) represents 36% of Subsea revenue. Political or regulatory changes in Brazil could disproportionately affect the order book.
Insider Selling: CEO Pferdehirt sold $45.7M in shares in March 2026, CFO Melin sold $7.9M, CTO Rounce sold $10.7M, and President Subsea Landes sold $7.2M. The breadth of C-suite selling in a concentrated window, while partially explained by a vesting cycle and the 191% stock appreciation, is a yellow flag. All executives retained substantial holdings (CEO still owns $186M+), but this warrants monitoring.
Effective Tax Rate Normalization: The tax rate has risen to 27.2% for 9M 2025, up from near-zero in prior periods when valuation allowance releases benefited results. This is now a permanent headwind to EPS growth relative to pre-tax earnings growth.
Tariff and Trade Policy: TechnipFMC’s global supply chain creates exposure to tariff disruption. The company has explicitly flagged this risk in its filings.
Options Market Signal
Near-term ATM implied volatility is 127.2% (1-day expiry), dramatically above 1-year historical volatility of 31.6%. This extreme reading reflects expiration-day noise rather than a durable signal. The 1-month IV of 42.0% and 3-month IV of 39.8% are both elevated relative to 31.6% HV but not at panic levels. The term structure is in backwardation (near-term vol above longer-dated), consistent with a market pricing near-term event risk — potentially related to Q1 2026 earnings expectations or geopolitical energy developments. Put/call OI ratio of 0.14 is extremely call-heavy, indicating speculative upside positioning rather than institutional hedging. This confirms the bullish fundamental thesis, though the elevated IV means the entry is not cheap from a volatility standpoint.
