
Investment Research Report: Micron Technology (MU)

Executive Summary
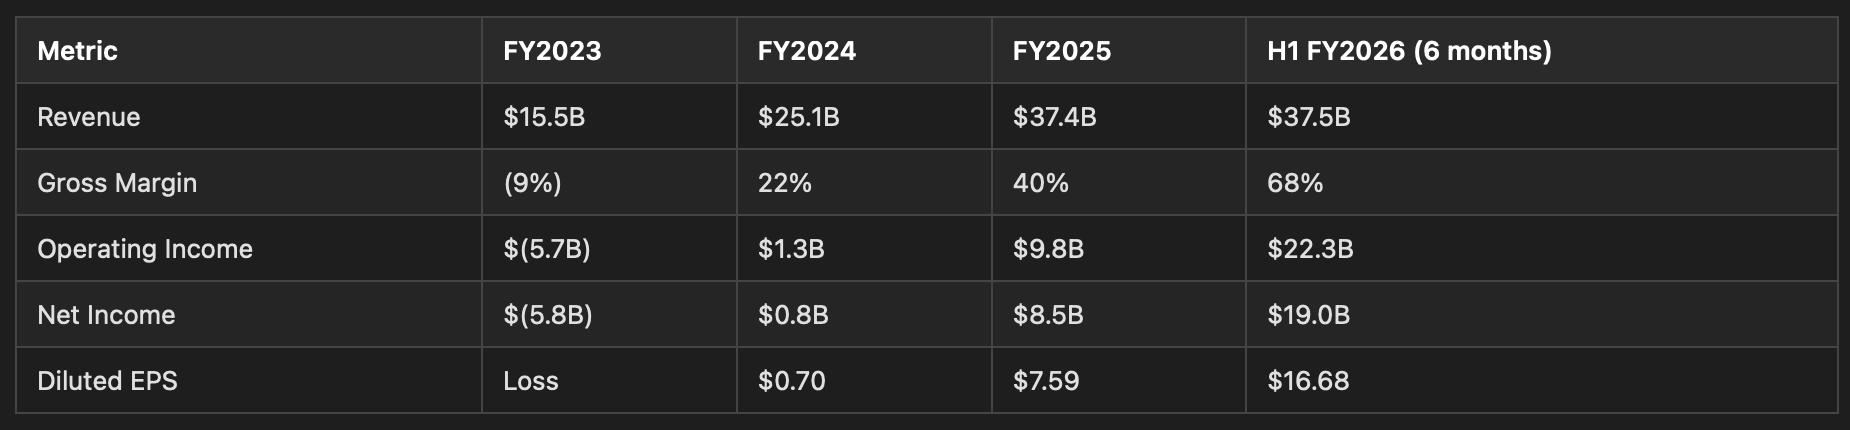
Micron Technology is in the middle of the most powerful earnings inflection in memory semiconductor history. Q2 FY2026 (ended February 2026) delivered $23.86B in revenue (+196% YoY), 74% gross margins, and $12.07 EPS — significantly beating prior guidance and expectations. Analyst estimates have risen substantially over recent months across all forward periods, reflecting a fundamental re-rating of the company’s earnings power driven by AI-related demand for HBM and high-capacity DRAM that exceeds global supply.
At the current price of approximately $487–$512 (based on recent trading data), the stock trades at a forward P/E that remains attractive relative to its growth trajectory. The critical question is whether current margins (74% gross, 68% operating) represent a sustainable new level or a cyclical peak. With AI-driven memory demand outpacing industry supply, new fab capacity not arriving until 2027-2028, and the oligopoly structure limiting supply response, the balance of evidence favors sustained above-trend profitability for at least 4-6 more quarters — though normalization toward 50-60% gross margins over a 2-3 year horizon is probable.
The primary risks are real: memory industry cyclicality is severe (Micron swung from +$8.7B to -$5.8B net income in a single year previously), geopolitical concentration in Taiwan, and the possibility that $100B+ in new capacity commitments across the industry eventually overshoot demand. These risks justify the valuation discount to peers but do not override the earnings momentum signal at current multiples.
Company Overview
Micron Technology is one of three global DRAM oligopolists (alongside Samsung at ~40% share and SK hynix at ~30%), with approximately 25% DRAM market share and a meaningful NAND position. The company reorganized into four business units in Q4 FY2025:
Cloud Memory (CMBU): 35% of H1 FY2026 revenue. HBM for AI accelerators plus hyperscale cloud memory. Revenue grew 257% YoY in FY2025 and continues accelerating.
Core Data Center (CDBU): 22%. Mid-tier cloud, enterprise, and OEM data center memory plus all data center storage.
Mobile and Client (MCBU): 32%. Smartphone and PC memory/storage.
Automotive and Embedded (AEBU): 12%. Automotive, industrial, and consumer.
The company operates manufacturing facilities in Taiwan, Singapore, Japan, the U.S., Malaysia, China, and India, employing approximately 53,000 people.
Financial Analysis
Revenue and Profitability
Q2 FY2026 specifically: $23.86B revenue, 74% gross margin, $13.8B net income, $12.07 diluted EPS. DRAM ASPs rose mid-60% sequentially; NAND ASPs rose high-70% sequentially. Management described this as “the largest sequential revenue increase in its history.”
Cash Flow and Balance Sheet
Operating cash flow reached $20.3B in just the first six months of FY2026 (vs. $17.5B for all of FY2025). Cash and investments stand at $16.6B against $10.1B in total debt — effectively net cash. The company prepaid $4.6B of debt in six months, with remaining maturities concentrated in 2031-2051.
Capital expenditures of $11.8B in H1 FY2026 are substantial, with guidance exceeding $25B for the full year. CHIPS Act grants ($6.4B total, $2.26B already received) and 35% investment tax credits partially offset this burden. Free cash flow is approximately $8.5B for H1 despite the massive capex program.
The current ratio of 2.52 and rapidly declining debt/equity (0.53 and falling) confirm balance sheet strength. The only notable concern is the receivables build — trade receivables doubled from $7.2B to $15.4B in six months, which management should address regarding customer payment term extensions.
Capital Returns
Micron raised its quarterly dividend 30% to $0.15/share and repurchased $650M of stock in H1 FY2026, with $2.16B remaining under the $10B authorization. The priority is clearly capacity expansion, with returns to shareholders secondary but increasing.
Growth Analysis
Estimate Revision Velocity
This is among the strongest estimate revision trajectories observable in large-cap equities. Analyst estimates for FY2026 and FY2027 EPS have risen dramatically following Q2 results and Q3 guidance (management guided Q3 FY2026 to GAAP EPS of $18.90 ± $0.40 and revenue of $33.5B ± $750M). The magnitude of upward revisions — reported by various sources as exceeding 70–130% over 90-day periods — combined with a 4-quarter consecutive beat streak, confirms that consensus has been systematically underestimating the fundamental inflection.
Demand Drivers
HBM for AI accelerators: Management has indicated AI-driven memory demand is outpacing industry supply. HBM3E 12-high is in volume production, and HBM4 development is progressing toward production ramp. HBM production requires more wafers per bit than standard DRAM, creating supply constraints across the entire DRAM market.
High-capacity server DIMMs: AI servers require 8-16x the DRAM of conventional servers. Data center buildout driven by large-scale hyperscaler AI capex programs creates sustained multi-year demand.
NAND for AI training: High-performance SSD demand for training data storage.
Supply constraints persist: Per Micron’s 10-Q, “AI-driven memory and storage growth is outpacing industry supply… demand for memory and storage exceeds overall industry supply.” The company is making supply allocation decisions across customers and markets.
Six independent semiconductor demand confirmations (Korea exports +48%, SK Hynix +12%, Samsung $1T market cap, QCOM data center beat, GFS beat, AMD +20% data center) all corroborate the same structural demand shift benefiting Micron directly.
Growth Durability Assessment
The multi-year AI infrastructure capex cycle, supported by public guidance from major hyperscalers, provides extended demand visibility. The constraint is supply, not demand — Micron’s management describes making “supply allocation decisions across customers and markets,” the hallmark of a structural shortage. New fabs (Boise mid-2027, Singapore H2 2028, New York 2030+) indicate management also sees multi-year demand support.
Valuation Assessment
Forward Multiple Analysis
At approximately $487–$512 per share (based on recent trading data as of late April/early May 2026) with approximately 1.128B shares outstanding:
Estimated market cap: ~$550–$578B
Based on available consensus estimates (which have been rising rapidly following Q2 results and Q3 guidance of $18.90 EPS), the forward P/E remains attractive. Yahoo Finance reported a forward P/E of approximately 7.7x as of late April 2026.
PEG ratio on consensus growth estimates remains well below 1.0x.
The trailing P/E reflects the period when Micron was still emerging from cyclical trough (FY2023 losses into FY2024 recovery) and is less relevant. The forward P/E at current levels is cheap by semiconductor standards given the growth trajectory.
Peer Comparison
Memory/semiconductor peers generally trade at significantly higher forward P/E multiples than Micron. The discount reflects the market’s correct assessment that memory is cyclical and current margins are unsustainably high. However, even normalizing gross margins to 50% (from current 74%) and applying a 12-15x multiple to normalized EPS of $40-50, fair value ranges from $480-750. The bull case applies peak margins for 2-3 more years with new-capacity support, yielding $800-1000.
Analyst Targets
Based on available data, the consensus analyst target is approximately $534, with a range from $249 to $852. Given that analyst estimates have risen dramatically following Q2 results and strong Q3 guidance, current consensus targets are likely stale and will be revised upward as analysts update models. 94% of covering analysts reportedly maintain bullish ratings.
Valuation Score Rationale
A single-digit or low-double-digit forward P/E on 75%+ earnings growth is objectively cheap. The discount reflects cyclicality risk — fair and appropriate. However, with supply constraints persistent and estimates still rising, the market is likely underpricing the duration of the current upcycle. The stock has appreciated substantially from its 52-week low of $78.54, but this was driven entirely by fundamental improvement (EPS going from losses to potentially $50-100+ annually), not multiple expansion. A 5.5 score reflects “reasonably priced for the growth” rather than “screaming cheap” — the cyclical risk is real and justifies some discount.
Competitive Landscape
Oligopoly Pricing Power
The DRAM market’s three-player structure (Samsung, SK hynix, Micron) provides extraordinary pricing power during supply-constrained periods. All three are currently capacity-constrained and allocating supply. This structural foundation enables 74% gross margins — no single player has incentive to aggressively expand capacity and crash prices when all three are generating record profits.
Technology Leadership
Micron holds specific advantages:
First to ship 1-gamma (1γ) DRAM with EUV lithography
HBM3E 12-high in volume production; HBM4 development progressing
Strong and improving competitive position in HBM relative to SK hynix (having been behind 12-18 months ago, Micron has narrowed the gap significantly)
Strong IP portfolio (48,000+ patents)
Chinese Competition
CXMT (DRAM) and YMTC (NAND) are expanding with Chinese state support but remain 2-3 generations behind on leading-edge technology. The MATCH Act lobbying, if successful, would widen this gap further. Meanwhile, the CAC ban on Micron products in Chinese critical infrastructure (since May 2023) has reduced China exposure — limiting downside but also capping TAM.
Competitive Position Trajectory
Micron’s competitive position is improving: gaining HBM share, expanding data center presence, and transitioning to higher-value products. The segment restructuring signals management’s strategic pivot toward the highest-growth, highest-margin markets.
Risk Assessment
Cyclicality — The Dominant Risk
Memory semiconductors exhibit the most extreme cyclicality in the semiconductor industry. Micron’s own disclosure states DRAM ASPs can swing from +40% to -40% annually. Current mid-60% QoQ increases are at historic extremes. Any investor must size positions with the understanding that a 50-70% drawdown is possible over a full cycle, even if not imminent.
Probability of significant margin compression (gross margins back to 40-50%) within 18 months: 25-35%. Within 36 months: 50-60%.
Geopolitical Concentration
A majority of DRAM production is in Taiwan and South Korea. Cross-strait conflict would be catastrophic — effectively a binary risk that is unhedgeable. Additionally, rare earth dependency on China and ongoing Section 232/301 trade investigations create regulatory uncertainty.
Capacity Overshoot
Micron, Samsung, and SK hynix are all investing $50-100B+ in new capacity. If AI demand moderates or supply arrives faster than expected, the industry could flip from shortage to oversupply as it has in every prior cycle. New Micron fabs coming online 2027-2030 could contribute to this.
Litigation
The Netlist $445M verdict (on appeal) and expanding YMTC patent disputes create non-trivial legal liabilities. While manageable against current earnings, they add tail risk.
Regulatory Scrutiny
The new risk language in the 10-Q about supply constraints potentially triggering “government and regulatory focus” suggests Micron’s legal team anticipates potential antitrust scrutiny of memory pricing. This is a longer-term risk to the oligopoly pricing model.
This publication is for informational and educational purposes only and does not constitute financial, investment, or trading advice. The analysis, opinions, and commentary presented here should not be interpreted as a recommendation to buy, sell, or hold any security. Always conduct your own research and consult a qualified financial advisor before making investment decisions. Past performance does not guarantee future results.
Option Market Signals, Investment Thesis, Investment Horizon and Exit Criteria below, for subscribers.
