
Investment Research Report: Boot Barn Holdings, Inc. (BOOT)
Dominant Western Retailer Trading at 38% Discount to Lowest Analyst Target After 33% Drawdown

Boot Barn is the largest specialty retailer of western and work-related footwear, apparel, and accessories in the United States, operating 514 stores across 49 states with a 4x+ scale advantage over its nearest direct competitor. The company delivered 16% revenue growth and $2.79 EPS in its most recent quarter (Q3 FY26, ended December 2025), raised full-year guidance to $7.25-$7.35, and is executing a credible store expansion plan targeting a ~900-store domestic footprint.
The stock has declined 33% from its December 2025 52-week high of $210.25 to $140.81, driven by broad consumer discretionary derating, tariff fears, and macro uncertainty. However, fundamentals have not deteriorated: estimates are flat-to-slightly-positive over 90 days, Q3 results confirmed accelerating same-store sales, and management guided to continued momentum. At ~19.3x FY26 guided EPS of $7.30, the stock trades at a meaningful discount to both its own historical growth rate and the median analyst target of $227.50. The primary risks are consumer spending sensitivity in a stagflationary environment, Mexico tariff escalation, and inventory buildup — but the magnitude of the price decline already embeds substantial pessimism relative to the operational trajectory.
Company Overview
Boot Barn was founded in 1978 and has grown into the dominant U.S. retailer in the western/work wear niche. Key characteristics:
459 stores (fiscal year-end March 2025), expanding to 514+ by December 2025 with 65-70 new stores planned for FY26
Product mix: Boots 47%, apparel 37%, accessories 16%; western ~70%, work ~30%
Exclusive brands at 38.6% penetration (Cody James, Shyanne, Hawx, Idyllwind) — carrying 200-400bps higher merchandise margins than third-party brands
Loyalty program: 9.6 million active members, majority of sales from enrolled customers
E-commerce: 10.5% of total sales with 114M+ annual website visits
TAM: Management estimates U.S. supports ~900 stores (75% upside from current base)
Financial Analysis
Revenue & Earnings Trajectory:
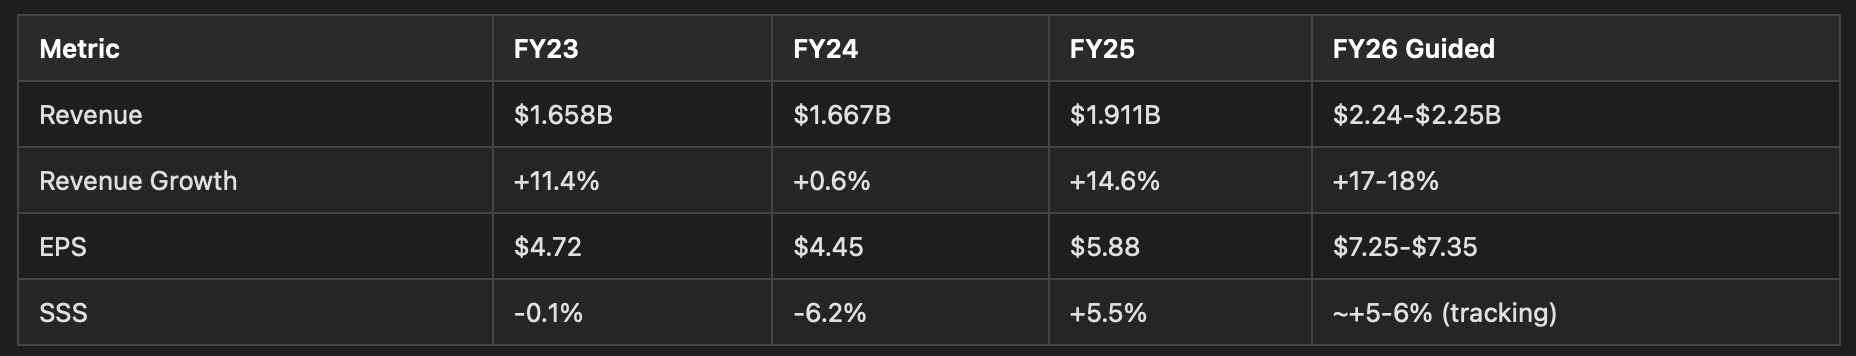
FY25 represented a strong recovery from the FY24 trough. FY26 is accelerating further with Q3 delivering 16% revenue growth and the first 5 weeks of Q4 showing +5.7% same-store sales (9.1% excluding winter storm impact).
Margin Profile (FY25):
Gross margin: 37.5% (+70bps YoY)
Operating margin: 12.5% (+60bps YoY)
Net margin: 9.5% (+70bps YoY)
ROE: 16.0%
Margin expansion is driven by exclusive brand penetration (each +1pp of mix = ~20-40bps of merchandise margin improvement) and fixed cost leverage on positive SSS.
Balance Sheet:
Zero debt drawn on $250M revolver
Cash: $69.8M
Current ratio: 2.45x
Altman Z-Score: 3.19 (safe zone)
D/E: 0.78x (primarily lease obligations, not financial debt)
Cash Flow:
Operating cash flow: $147.5M in FY25 (constrained by $148M inventory build for 60 new stores)
CapEx: $148.3M (store openings, new distribution center, HQ)
FCF: approximately breakeven in FY25
The near-zero FCF is a growth investment artifact. Each new store requires ~$1.7M net investment and targets 3-year payback on ~$4.1M annual sales. With FY26 capex guided at $115-120M and a new $200M buyback authorization, FCF should inflect positively as the store base matures.
Earnings Surprise History: 3 beats in 4 quarters (average beat +7.2% on beats; single miss was -3.4%). This suggests conservative guidance tendencies, consistent with management’s approach of guiding wide and raising.
Growth Analysis
Boot Barn’s growth story has three independent vectors:
Unit growth (10-15% annually): Current 514 stores vs. 900-store TAM estimate. At 65-70 openings/year, this runway extends through at least FY32. New store economics remain strong — $4M+ average sales, 3-year payback on $1.7M investment.
Same-store sales recovery/growth: After -6.2% in FY24, SSS recovered to +5.5% in FY25 and is tracking +5-6% in FY26. Drivers include the western lifestyle cultural resurgence, work wear demand from construction/energy employment, and loyalty program-driven marketing.
Exclusive brand margin expansion: At 38.6% penetration with room to grow toward 40-45%, each percentage point adds directly to merchandise margin. This is a controllable, internally-driven margin lever.
Estimate revisions are flat over 30/90 days (current year: $7.34; next year: $8.51, +0.5% in 90 days). This is neither a strong positive nor negative signal — estimates stabilized at the post-Q3 raised guidance level and have not deteriorated despite macro headwinds.
Forward growth: Consensus expects $8.51 EPS in FY27 (+16% growth), implying a forward PEG of ~1.0x on next year’s earnings — reasonable for a company with this growth profile and competitive position.
Valuation Assessment
Current valuation metrics:
Price: $140.81
Trailing P/E: 20.3x (on FY25 $5.88 EPS — but this understates current earnings power)
Forward P/E on FY26 guidance midpoint ($7.30): 19.3x
Forward P/E on FY27 consensus ($8.51): 16.5x
PEG ratio (using 16% FY27 growth): 1.0x
Peer comparison:
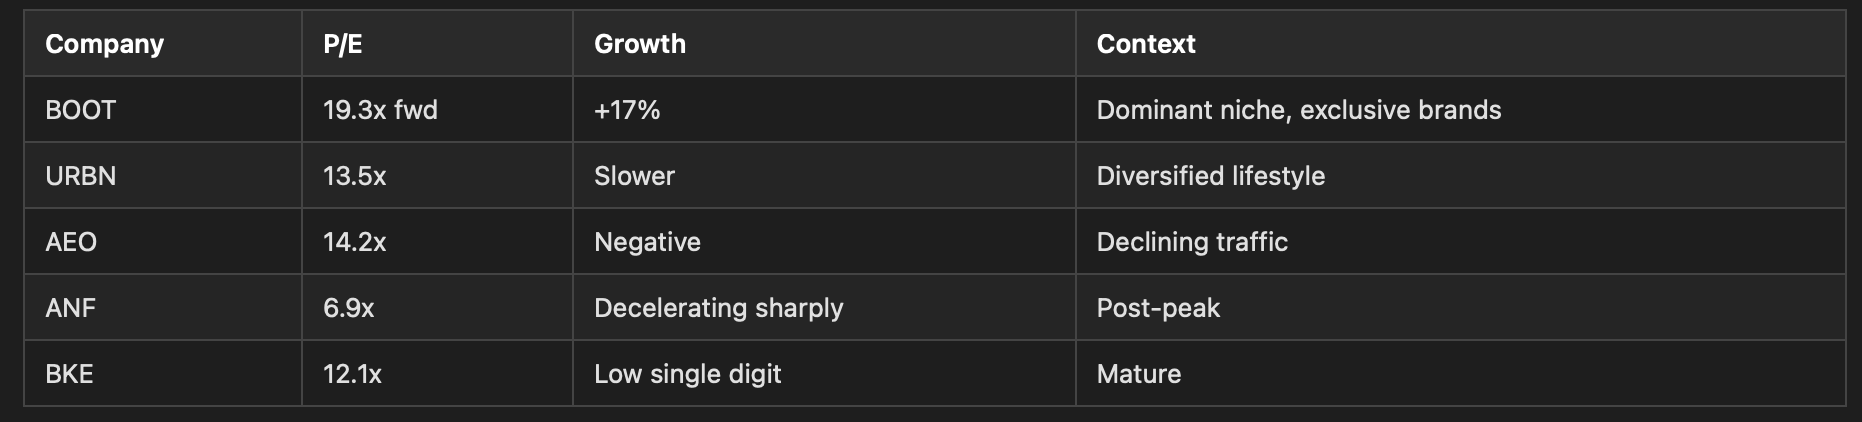
Boot Barn’s premium to peer median (13.5x) is justified by materially higher growth (+17% vs. low-single-digit peers), a 900-store TAM, and exclusive brand margin expansion. The question is whether the premium is too large in a hostile consumer environment.
Analyst consensus: Median target $227.50, low $195, high $282. Current price represents a 38% discount to the low analyst target and 62% discount to the median. With 15 of 16 analysts at Buy/Strong Buy, this is one of the widest gaps between price and consensus in the apparel retail space. Even applying a 20% haircut to the lowest analyst target ($195 × 0.8 = $156) still implies upside from current levels.
Why the market may be wrong at $141: The stock is pricing in a consumer recession scenario (FY24-like SSS declines of -6%), which would compress forward EPS toward $5.50-$6.00 and justify a ~$120-$130 floor. But Q4 FY26 same-store sales are tracking positive (+5.7% first 5 weeks), inventory is positioned for demand, and the company’s work-wear exposure (~30% of sales) provides counter-cyclical buffer from infrastructure/energy spending.
Competitive Landscape
Boot Barn’s competitive position is improving:
4x+ scale vs. nearest direct competitor in a fragmented market of thousands of independents
Independents lack the purchasing power, exclusive brand access, and marketing reach Boot Barn commands
Each new store opening in a market typically consolidates share from local mom-and-pop stores
Exclusive brand penetration rising (margin improvement without price increases)
E-commerce at 10.5% of sales with 114M visits provides omnichannel competitive moat
Threats: Tractor Supply (farm supply overlap), Amazon (boots/accessories), and mass merchants represent indirect competition but don’t focus on curated western/work lifestyle presentation. The “experience” element of Boot Barn shopping (fitting, expertise, lifestyle curation) creates meaningful defensibility vs. online-only channels.
The western lifestyle/country culture demand appears secular rather than cyclical — it has persisted through multiple economic cycles since 1978. Current cultural tailwinds (country music popularity, rodeo attendance) are supplementary, not foundational to the thesis.
Risk Assessment
1. Consumer Spending Sensitivity (HIGH — Primary Near-Term Risk): Despite “necessity” positioning for work-wear customers, Boot Barn demonstrated clear cyclicality in FY24 (-6.2% SSS). With macro uncertainty elevated [unverified — specific CPI, gas price, savings rate figures not sourced], another SSS deceleration is plausible in H2 2026. The consumer spending environment presents meaningful risk heading into the next few quarters.
2. Tariff Escalation — Mexico (MODERATE): China exposure is well-managed (24% → 5%), but Mexico represents 35% of exclusive brand sourcing. If USMCA exemptions are revoked or tariffs applied to Mexico, the cost impact would multiply from the current ~$8M estimate to potentially $30-50M. This is the largest single-variable risk to earnings estimates.
3. Inventory Risk (MODERATE): Inventory +24.7% YoY vs. revenue +14.6%. Same-store inventory up 5.7%. If SSS momentum fades, markdown pressure would compress gross margins. Management has historically managed inventory well (no fire sales in FY24 despite negative comps), but the absolute level is elevated.
4. Short Interest (ELEVATED SIGNAL): 12.3% of float shorted with 3.5 days to cover. This indicates institutional bearish positioning. However, elevated short interest also creates potential squeeze dynamics if fundamentals continue to outperform.
5. CEO Transition (FADING): John Hazen’s first three quarters show accelerating results. Risk is diminishing with each passing quarter.
This publication is for informational and educational purposes only and does not constitute financial, investment, or trading advice. The analysis, opinions, and commentary presented here should not be interpreted as a recommendation to buy, sell, or hold any security. Always conduct your own research and consult a qualified financial advisor before making investment decisions. Past performance does not guarantee future results.
Option Market Signals, Investment Thesis, Investment Horizon and Exit Criteria below, for subscribers.
